The AI Platform That Turns
Expenses Into Savings
Trusted by




Every invoice turns into data you can analyze
Ynance automatically reads every invoice and organizes each purchase by product, category, unit, and price. This lets you track spending, compare prices, and maximize savings
Reads
every line, every field
Standardizes
product, unit
Categorizes
spend organized around your categories
Sales tax checks
taxes verified by line, totals reconciled
HUDSON VALLEY FOODSERVICE LLC
Invoice INV-26084718 · 08/12/2026 · Ship to: New York, NY
Structured by Ynance
StructuredTOM VINERIP 20LB CS
3 CS × $79.00
$237.00
CA OLIVE RANCH EVOO 1GAL
4 EA × $41.50
$166.00
WATER 16.9OZ 24PK
10 CS × $7.99
$79.90
DISH DET 5GAL PAIL
4 EA × $86.00
$344.00
One invoice, four steps: ten 24-bottle water cases are standardized to 240 bottles, the unit price is calculated at $0.33 per bottle, the spend is assigned to the Beverages category, and the sales tax rate is checked on every line.
Then every price is checked against the market.
Ynance compares each invoice line with published wholesale prices, current retail offers, comparable hotels, and what you paid last time — and shows the observed price gap.
Vine-ripened tomatoes — loose
Delivered Aug 12, 2026 · New York, NY
You paid
$3.95/lb
Published wholesale benchmark
USDA AMS benchmark · normalized to $/lb
Lowest current retail price
Costco Business Center · sale price · checked today
Peer hotel median
Illustrative example · 11 comparable properties
Your purchase last time
Same item · 20 days ago
You paid $1.35/lb above the top of the published wholesale range. Across the 520 lb purchased this month, that is an observed price gap of $702.
Illustrative example — one item from one delivery. Ynance runs the same comparison across every eligible line. A savings opportunity is flagged only when the gap looks realistically actionable.
Choose the best buy— not simply the lowest price.
Ynance converts every quote into common units, flags brand and package differences and missing lines, compares each offer with the last price you paid, and recommends the best supplier for each product.
California Olive Ranch olive oil, 1 gal
AtlanticLast paid $41.50
Hudson Valley
Atlantic
Converted from a 4 × 1-gal case
Metro — new
Filippo Berio · Different brand
Dishwasher detergent, 5 gal
MetroLast paid $86.00
Hudson Valley
Atlantic
Metro — new
New supplier
Bottled water, 24-pack
Hudson ValleyLast paid $7.99
Hudson Valley
Atlantic
Metro — new
| Product | Last paid | Hudson Valley | Atlantic | Metro — new | Ynance recommends |
|---|---|---|---|---|---|
| California Olive Ranch olive oil, 1 gal | $41.50 | $40.80 Exact match | $40.00 Converted from a 4 × 1-gal case Best comparable offer | $37.20 Filippo Berio · Different brand Different brand | Atlantic |
| Dishwasher detergent, 5 gal | $86.00 | $83.00 | $81.50 | $76.00 New supplier Best comparable offer | Metro |
| Bottled water, 24-pack | $7.99 | $7.10 Best comparable offer | Not quoted | $7.40 | Hudson Valley |
All offers are compared on the same tax, delivery, and payment-term basis.
Recommended purchasing plan
Hudson Valley
31 products
Atlantic
38 products
Metro — new
15 products
Based on comparable products, delivery requirements, minimum orders, and payment terms.
Estimated savings compared with previous purchase prices: $1,846
Ask about your purchasing. Get the answer in seconds.
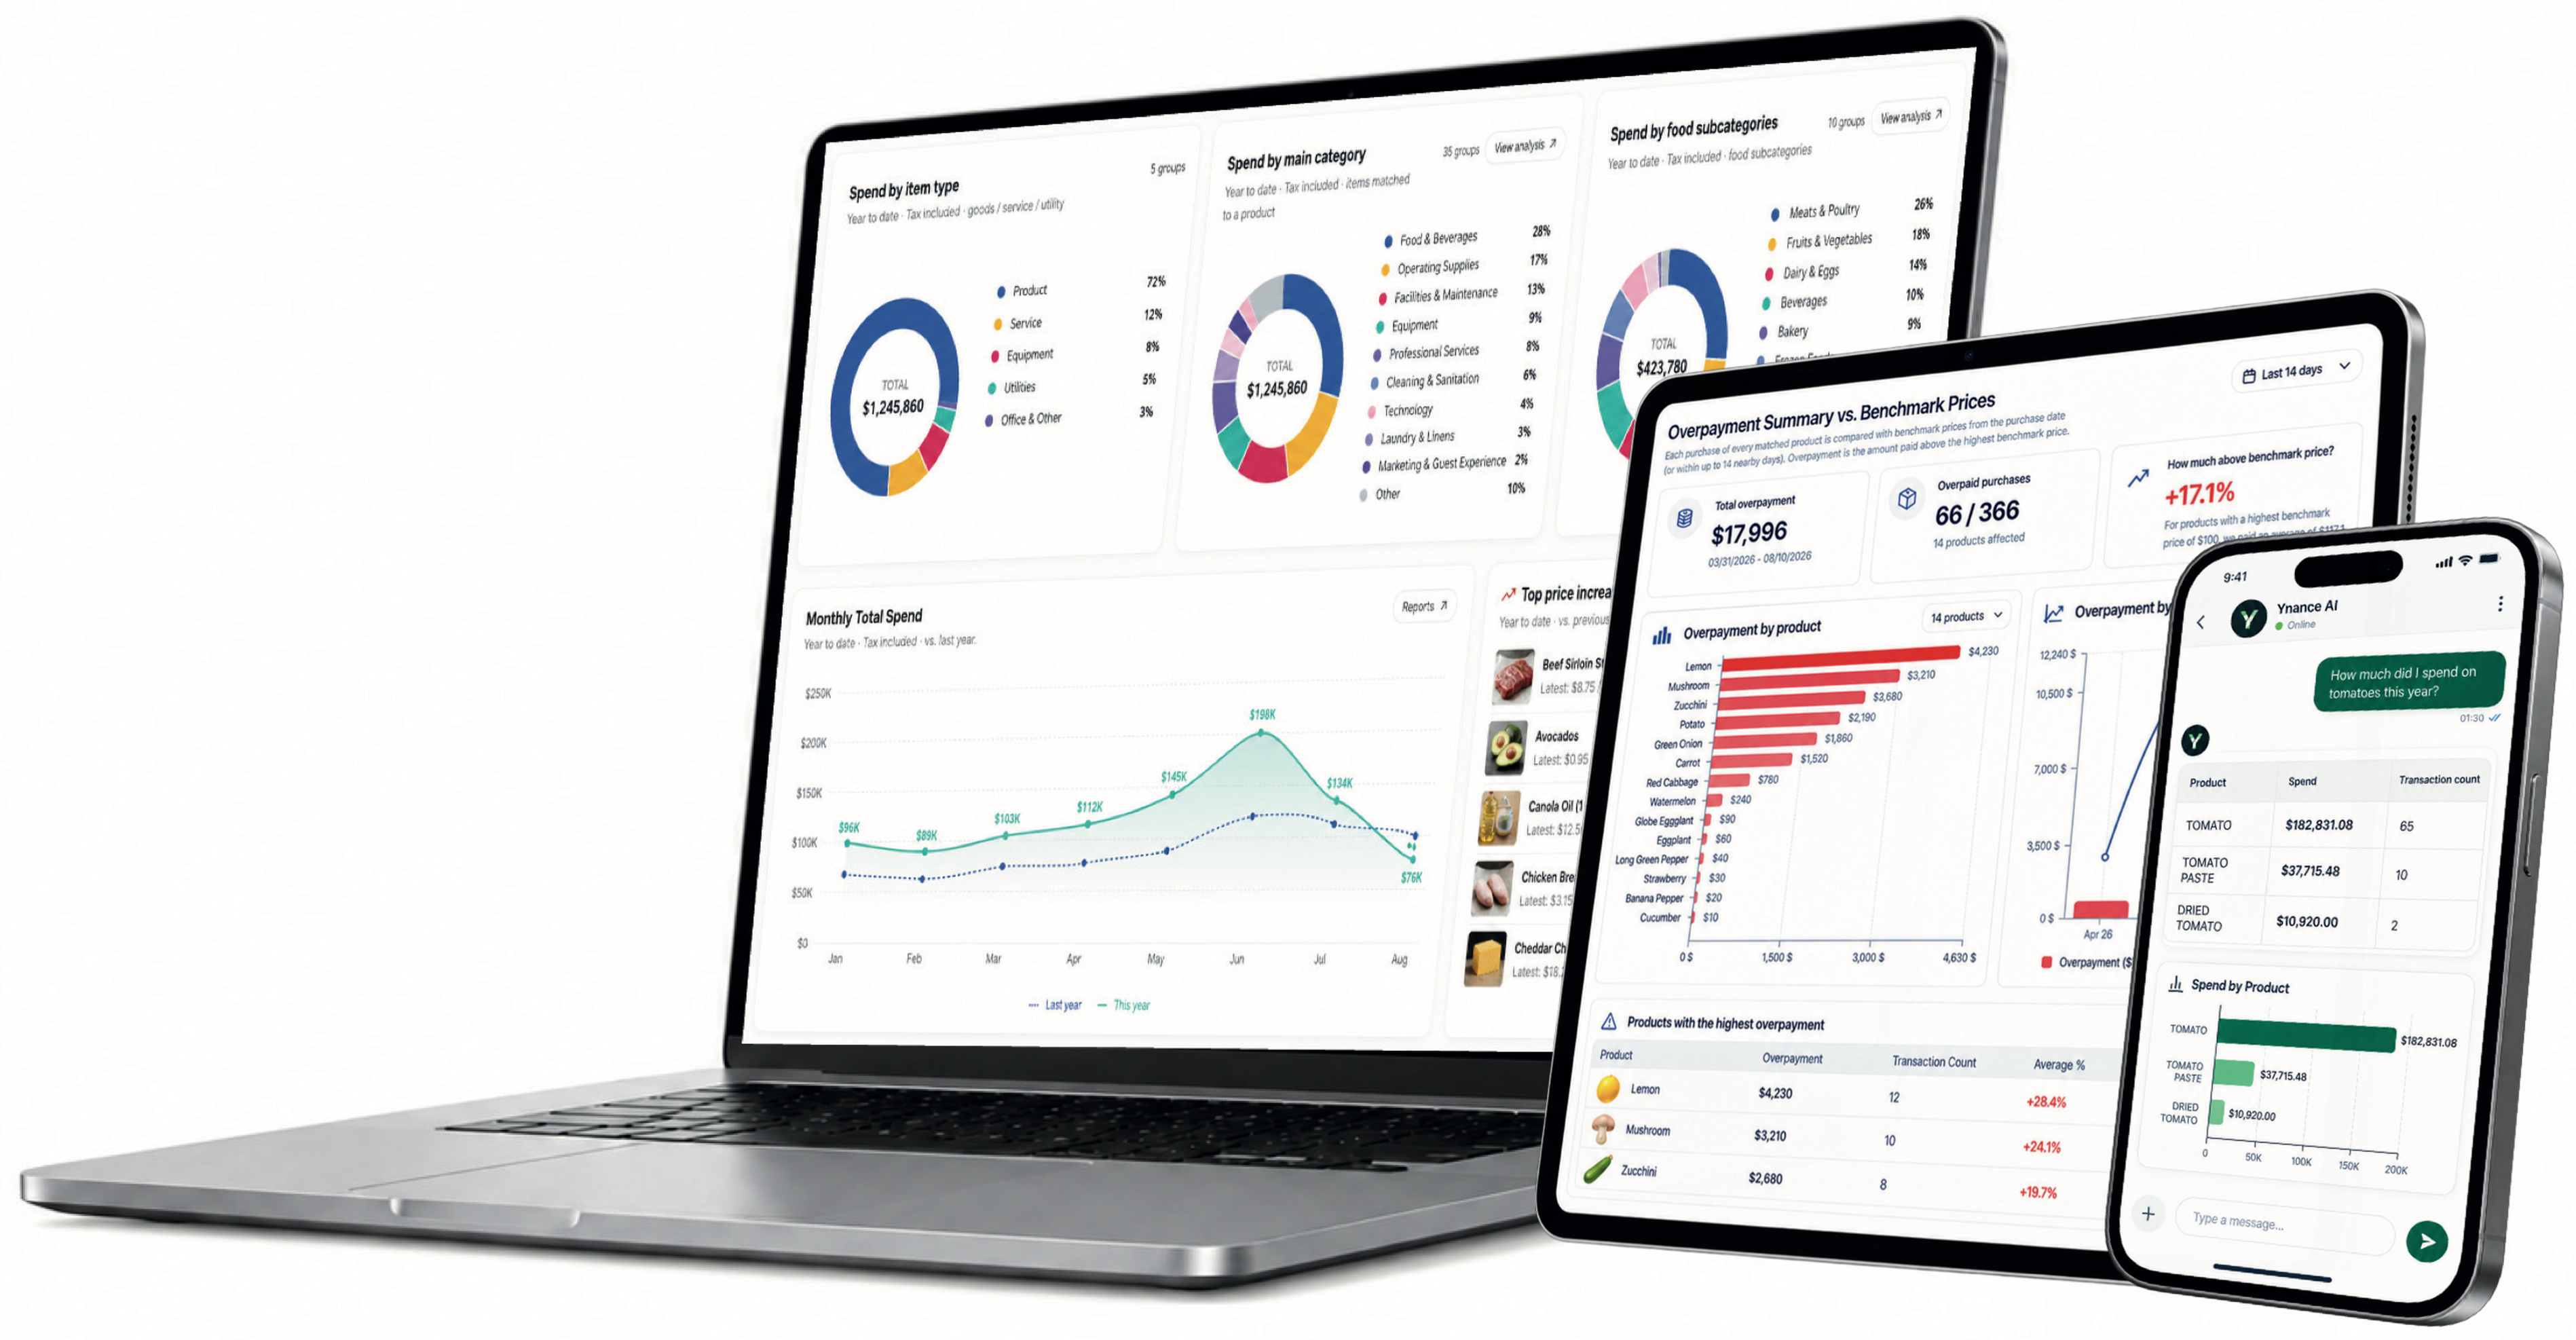
Curie analyzes every purchase invoice your organization has processed through Ynance. Ask your question the way you would ask a colleague—no report to build, no filters to configure, and no one to chase for data. Tables and charts are ready in seconds.

See electricity consumption together with occupancy and unit price
Ynance shows monthly electricity consumption together with occupied rooms and the effective unit price. You can see at a glance whether a change comes from occupancy, from unit price, or from an unusual deviation.
Consumption and occupancy
Bars are monthly kWh and the blue line is the occupied rooms that month. The dashed grey line is the consumption expected from occupancy; months that deviate significantly from it are flagged in red.
Consumption and unit price history
Bars are monthly kWh, the dashed line is the same month last year and the orange line is the effective unit price per kWh.